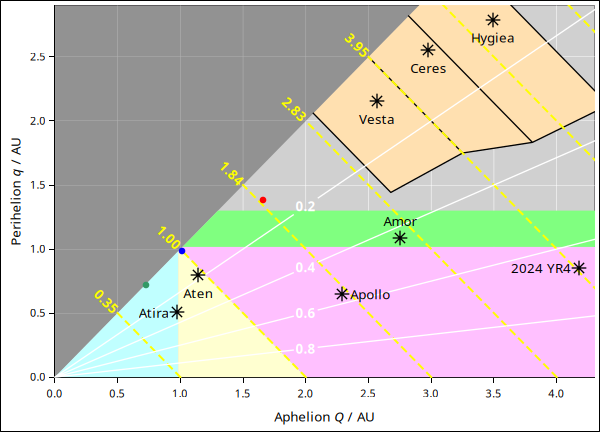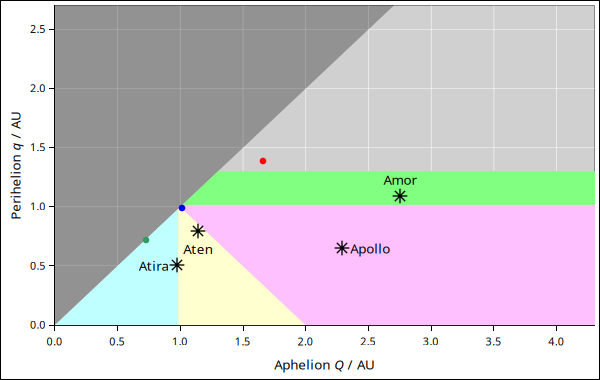
Figure 1: Near-Earth Asteroid Groups
Asteroids are placed into groups, based on the size and shape of their orbits.1, 2
The groups that are considered “near earth” asteroids are shown in figure 1. Specifically;
Notation: Q means aphelion, q means perihelion, ✳ means asteroid, and ⊕ means earth.
In the figure, the dark gray shaded region in the northwest corner corresponds to q>Q, which is mathematically impossible. The red, blue, and green dots are planets.
Figure 2 is the same as figure 1, with additional asteroids and additional quantifiers.
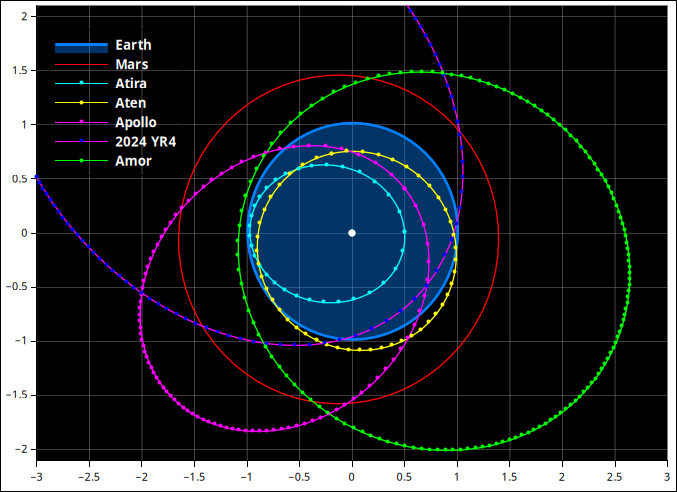
Asteroid 2024 YR4, which made the news in February 2025, is an Apollo object.7, 8
The straight lines through the origin correspond to constant eccentricity.
The yellow lines running from northwest to southeast are contours of constant semi-major axis a = (Q+q)/2. You can read the value of 2a at the lower end of the lines, i.e. the Q axis. The Kepler 123 law tells us they are also contours of constant orbital period. You can read the period, in years, at the upper end.
The main belt asteroids lie between Mars and Jupiter, shaded light peach in the diagram. They are not considered “near earth” asteroids. They are divided into three subgroups, split by the Kirkwood gaps. Conspicuous members are Vesta,9 Ceres,10 and Hygiea.11
Ceres is so large that it’s not even considered an asteroid, bur rather a dwarf planet, like Pluto.10
There are many other asteroids and groups of asteroids in the gray-shaded retion in the northeast corner of figure 2. We shall not discuss them here.
Figure 3 is another way of looking at the relationships between the groups. Each group is represented by its eponymous asteroid. (Also shown is part of the orbit for 2024 YR4, which is a member of the Apollo group.) The dots on the ellipses are spaced one week apart, so you can see how the asteroids speed up when they are near the focus, in accordance with Kepler’s second law.
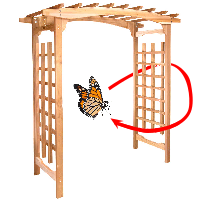
You cannot know whether any member of the Apollos or Atens will actually intersect earth’s orbit unless you know more than just the perihelion and aphelion. The whole grouping scheme, including figure 1 and figure 3, is based on a two-dimensional view of a three-dimensional situation. Depending on the inclination and other orbital elements,12 the asteroid could pass inside and outside the earth’s orbit without coming anywhere near. It’s like a small butterfly passing inside and ouside a large arch, as in figure 4. It can fly around all day without touching the arch.
In the celestial mechanics business, the notation is a mess.
| The scalars P, Q, and ω refer to period, semi-major axis, and argument of periapsis. Also sometimes ω is angular rate. | The vectors p, q, and w (or sometimes P, Q, and W) pertain to the perifocal coordinate system, also known as the pqw or PQW system.13 In several places the Minor Planet Center mentions P and Q without explanation, and instead says «you are referred to standard celestial mechanics textbooks», which is remarkably vague and unhelpful. You can easily find information about the perifocal coordinate system, if you know that’s what it’s called. |
Other descriptions are sometimes used.
It is often claimed that the three angles “are” the Euler angles (yaw, pitch, and roll), but that’s not true. You can describe them in terms of Euler angles, but that’s like describing Cartesian coordinates in terms of polar coordinates; it doesn’t make them the same thing. The actual description goes like this: Ω, i, and ω correspond to yaw, roll, and more yaw.
In contrast, the concept of longitude is messy. Consider the contrast:
| Longitude in this context, e.g. the longitude of the ascending node, refers to ecliptic longitude, measured in degrees around the ecliptic. | Right Ascension (RA) is analgous to terrestrial longitude. RA is measured along the celestial equator, which is coplanar with the terrestrial equator. Both are defined by the earth’s spin, not orbit. |
Terrestrial longitude is measured relative to Greenwich.
Right Ascension is measured from the March equinox.
Ecliptic longitude is also measured from the March equinox.
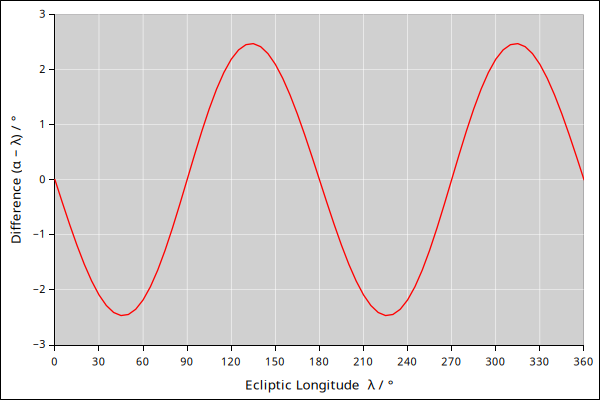
There are four times per year when the RA and the ecliptic longitude line up in a simple way; otherwise not so much. For example, 45∘ of ecliptic longitude is only 42.54∘ RA. See figure 5 and reference 14
The simple cases are:
At the time that was perfectly true, but things immediately went downhill from there. The same Hipparcos discovered the precession of the equinoxes, and knew that within a few years the equinox would be further west, somewhere in eastern Pisces.
Anybody with any sense would have kept the name First of Aries as a reference to the actual westernmost point in the actual Aries constellation, but apparently nobody had any sense. They persisted in using the term First of Aries to refer to the equinox. That was nutty then and it’s even nuttier now.
Nowadays the equinox is 30∘ west of Aries in western Pisces, which overlaps with eastern Aquarius.15 Nevertheless, even to this day legitimate astronomers make diagrams that mark the equinox with the symbol ♈, which is the symbol for Aries the ram.
Strictly speaking, the earth does not orbit the sun. It would be far more accurate to say the earth orbits the center of mass of the solar system, i.e. the barycenter, which is displaced relative to the sun, as discussed in section 5.
Some of the confusion is due to terminology or lack thereof. According to the dictionary, the words perihelon, periastron, and periapsis all refer to distance from the central body, not the focus of the ellipse. This is particularly annoying in the case of periapsis, which comes from a Greek word meaning arch, which really ought to refer to the pointy end of the ellipse, without regard to what does or doesn’t sit at the focus.
We can escape this quagmire by using the very rare word perifocus if that’s what we mean.
The problem occurs when people use the standard orbital elements of the earth’s orbit to calculate the peri-something. They are in fact calculating the perifocus, but they almost always call it the “perihelion”, which is not the same thing. The amount of the discrepancy varies from year to year, but most of the time it’s noticeable, and in 2025 it’s almost as big as it ever gets.
| It is straightforward to calculate the shape of a planet’s orbit, without regard to time, in terms of the orbital elements. The “orbit equation” applies here.16 | It is more complicated to find the planet’s actual position in space, as a function of time, even after introducing some approximations.17 |
The center of mass aka barycenter is the weighted average of the positions of all the objects in the solar system, weighted according to mass:
| (1) |
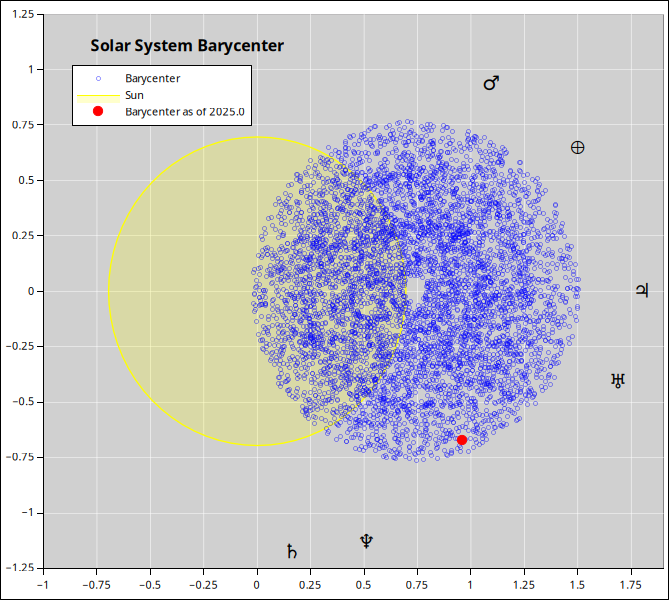
Equation 1 is independent of whatever coordinate system (if any) we choose. For the moment, however, we choose to put the sun at R=0, and separate the solar term from the planetary terms. The four giant planets contribute about 99.5% of the planetary mass and about 99.95% of the RM product. Jupiter alone contributes about 71% of the planetary mass and 49% of the RM product. To put these numbers into perspective: It is weirdly ironic when people say the barycenter is displaced from the center of the sun “because of Jupiter”. That’s not even half true, and in some sense it’s completely wrong. The center of mass of the Sun/Jupiter binary system is the center of the doughnut hole in figure 6, which is one place where the true system barycenter will never be.
The planets are sufficiently massive (and sufficiently distant) that more often than not, the barycenter is outside the surface of the sun. Not terribly far outside, but outside, as shown in figure 6. The blue points are the barycenters we get if we sample the position of the planets at 6000 random times spread over a few thousand years.
The data is plotted in such a way that the vector from the sun to Jupiter always runs horizontally left to right. In other words, we have subtracted out Jupiter’s orbital motion.
The planets shown around the periphery are obviously not to scale. They are meant as a rough — very rough – qualitative indication of the direction in which each planet is pulling the barycenter at the moment. In particular, the angular relationships between one planet and the others are not accurately portrayed.
The red dot accurately indicates the barycenter as of January 4th, 2025, when the earth was at perifocus. The sun is displaced from there by about 1.2 billion meters. (It was worse in 2000, when Jupiter was in conjunction with Saturn.)
There is some intriguing structure in the diagram. Sometimes people who ought to know better assume that if you add a few random numbers you get a Gaussian, but that’s definitely not true. The probability distribution in figure 6 is rotationally symmetric, but it’s definitely not Gaussian. For starters, rather than having a peak in the middle, it has zero density at and near the center. There are also a couple of rings of increased density. If you stand back and squint a little the structure becomes more apparent.
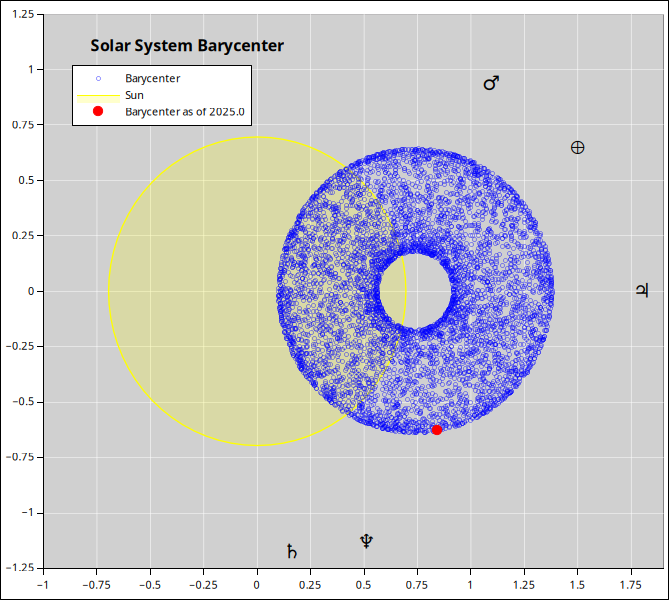
We can better understand the structure with the help of figure 7. It shows what would happen if Uranus were magically removed from the solar system. We have already subtracted out the motion of Jupiter, so what remains is only two random variables. The inner boundary of the doughnut corresponds to Saturn minus Neptune, while the outer boundary corresponds to Saturn plus Neptune.
To compute the distance to the actual sun (as opposed to the barycenter) requires knowing a lot more than just the earth’s orbital elements. There is software to do it.19